
Connected contacts
See how many contacts are actually linked to the campaign.
Track activity, relationships and progress per campaign, employee and period, so outbound doesn’t just become a gut feeling.
A good campaign setup requires more than activity logging. You need to be able to see the number of connected contacts, how many invitations have been accepted, and how the activity is distributed across employees and days.
See how many contacts are actually linked to the campaign.
Track how many contacts have accepted the invitation.
Make it clear what proportion of sent invitations are accepted.
Use the period view to see whether the campaign is building momentum or needs adjusting.
The box is built as an interactive version of the activity chart. You can choose exactly the categories you want to show, and the totals under each day update automatically.
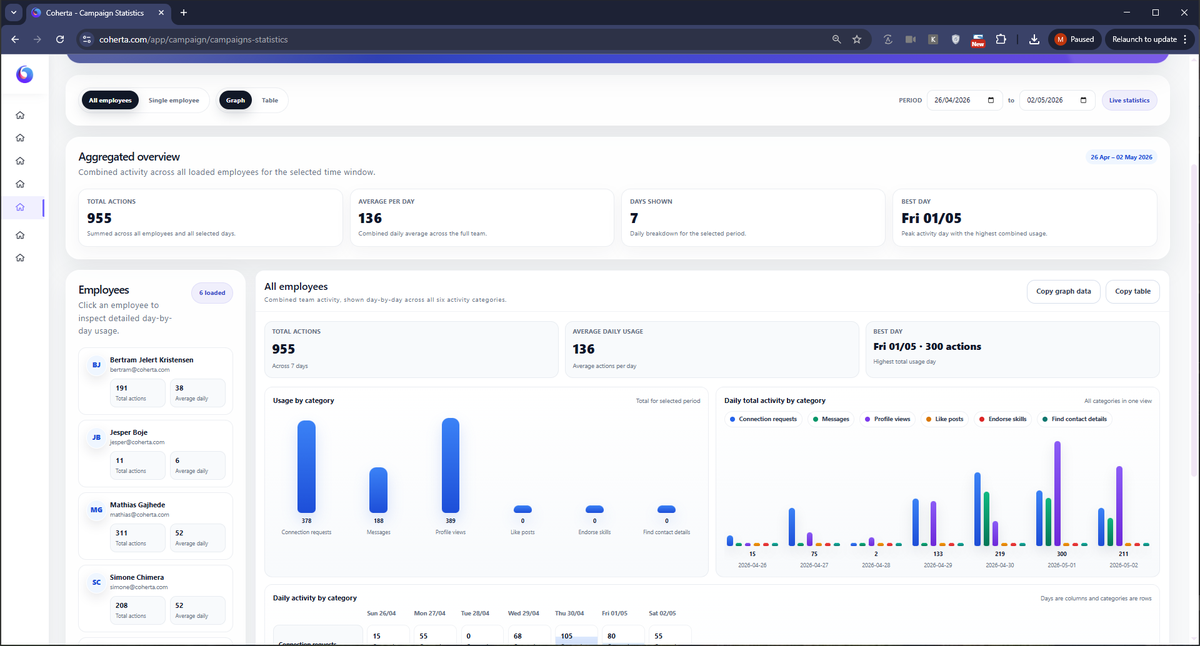
Employee Statistics makes it possible to see how the campaign is carried out in practice. This matters because two employees can have the same campaign, but very different activity, pacing and response.
The employee statistics help sales leadership understand where there is capacity, where activity is lacking, and where limits or workload distribution may need adjusting.
Start with the most recent days, and change the period when reporting requires it.
Use tables and views to understand how the activity is distributed.
Data can be used directly in Excel, PowerPoint or internal status meetings.
Coherta Campaigns can show activity in the categories that create the campaign’s rhythm. This makes reporting concrete instead of only showing a single total.
How many invitations were sent in the period.
How many messages were sent as part of the campaign.
How many profiles were visited to create visibility.
How much light engagement was carried out.
How many skill endorsements were completed.
How many times Coherta attempted to find contact details.
The statistics shouldn’t just be displayed. They should be used to improve the next campaign.
Coherta Campaigns makes activity, relationships and progress visible, so you can manage sales work with data.
Choose a time and enter your details.